Cart Abandonment: The Questions You Should Be Asking (and How to Answer Them with Mixpanel)
Half your carts get abandoned. Now what? A practical guide to using Mixpanel funnels to understand why users leave their carts behind.
More than 50% of e-commerce carts end up abandoned. It's one of those numbers everyone knows and almost no one knows what to do with. The question isn't why it happens —it always does— but what your own data can tell you about how to reduce it.
In this series we'll walk through concrete Mixpanel reports that turn "my abandonment rate is high" into actionable hypotheses. We start with the basics: defining the metric properly, and asking the data the right questions.
Defining the Cart Abandonment Rate metric
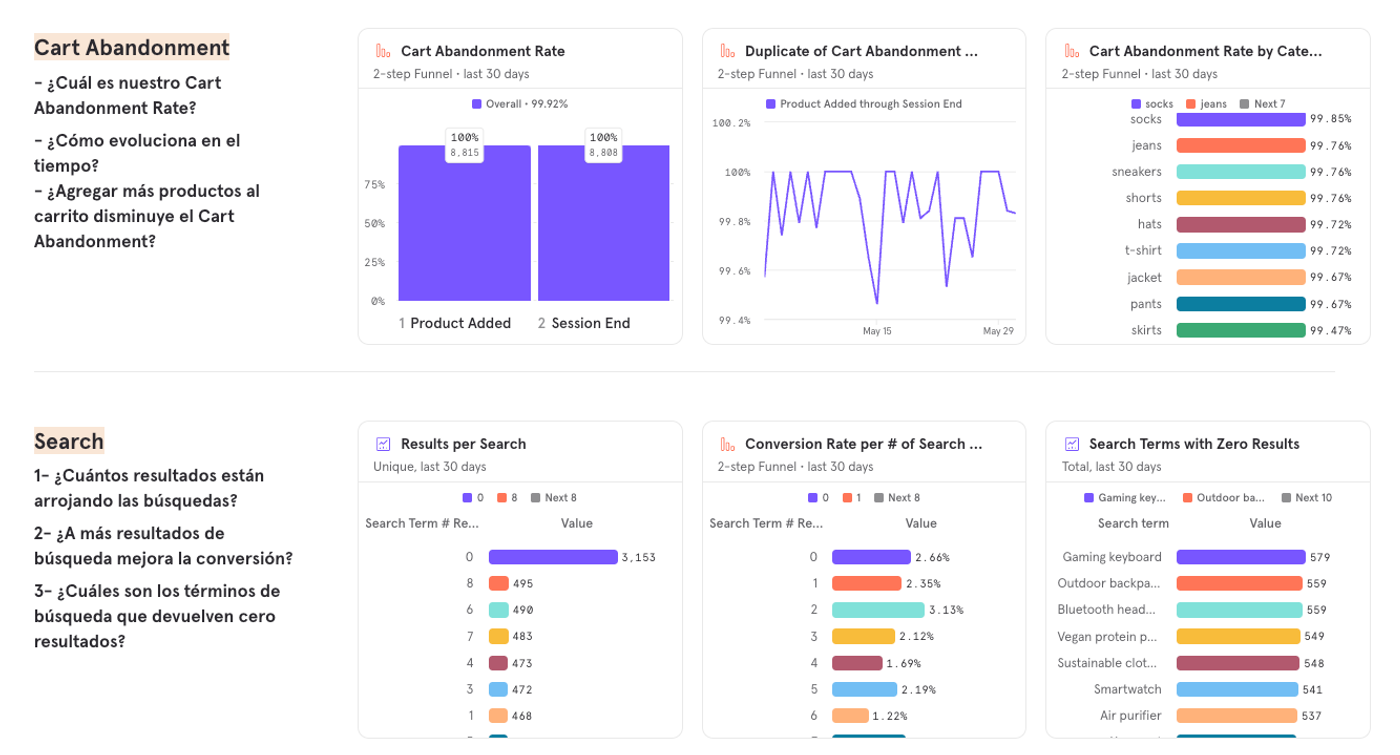
Let's first define Cart Abandonment Rate as the rate of users who add a product to the cart and then end the session without completing a purchase. Makes sense, right?
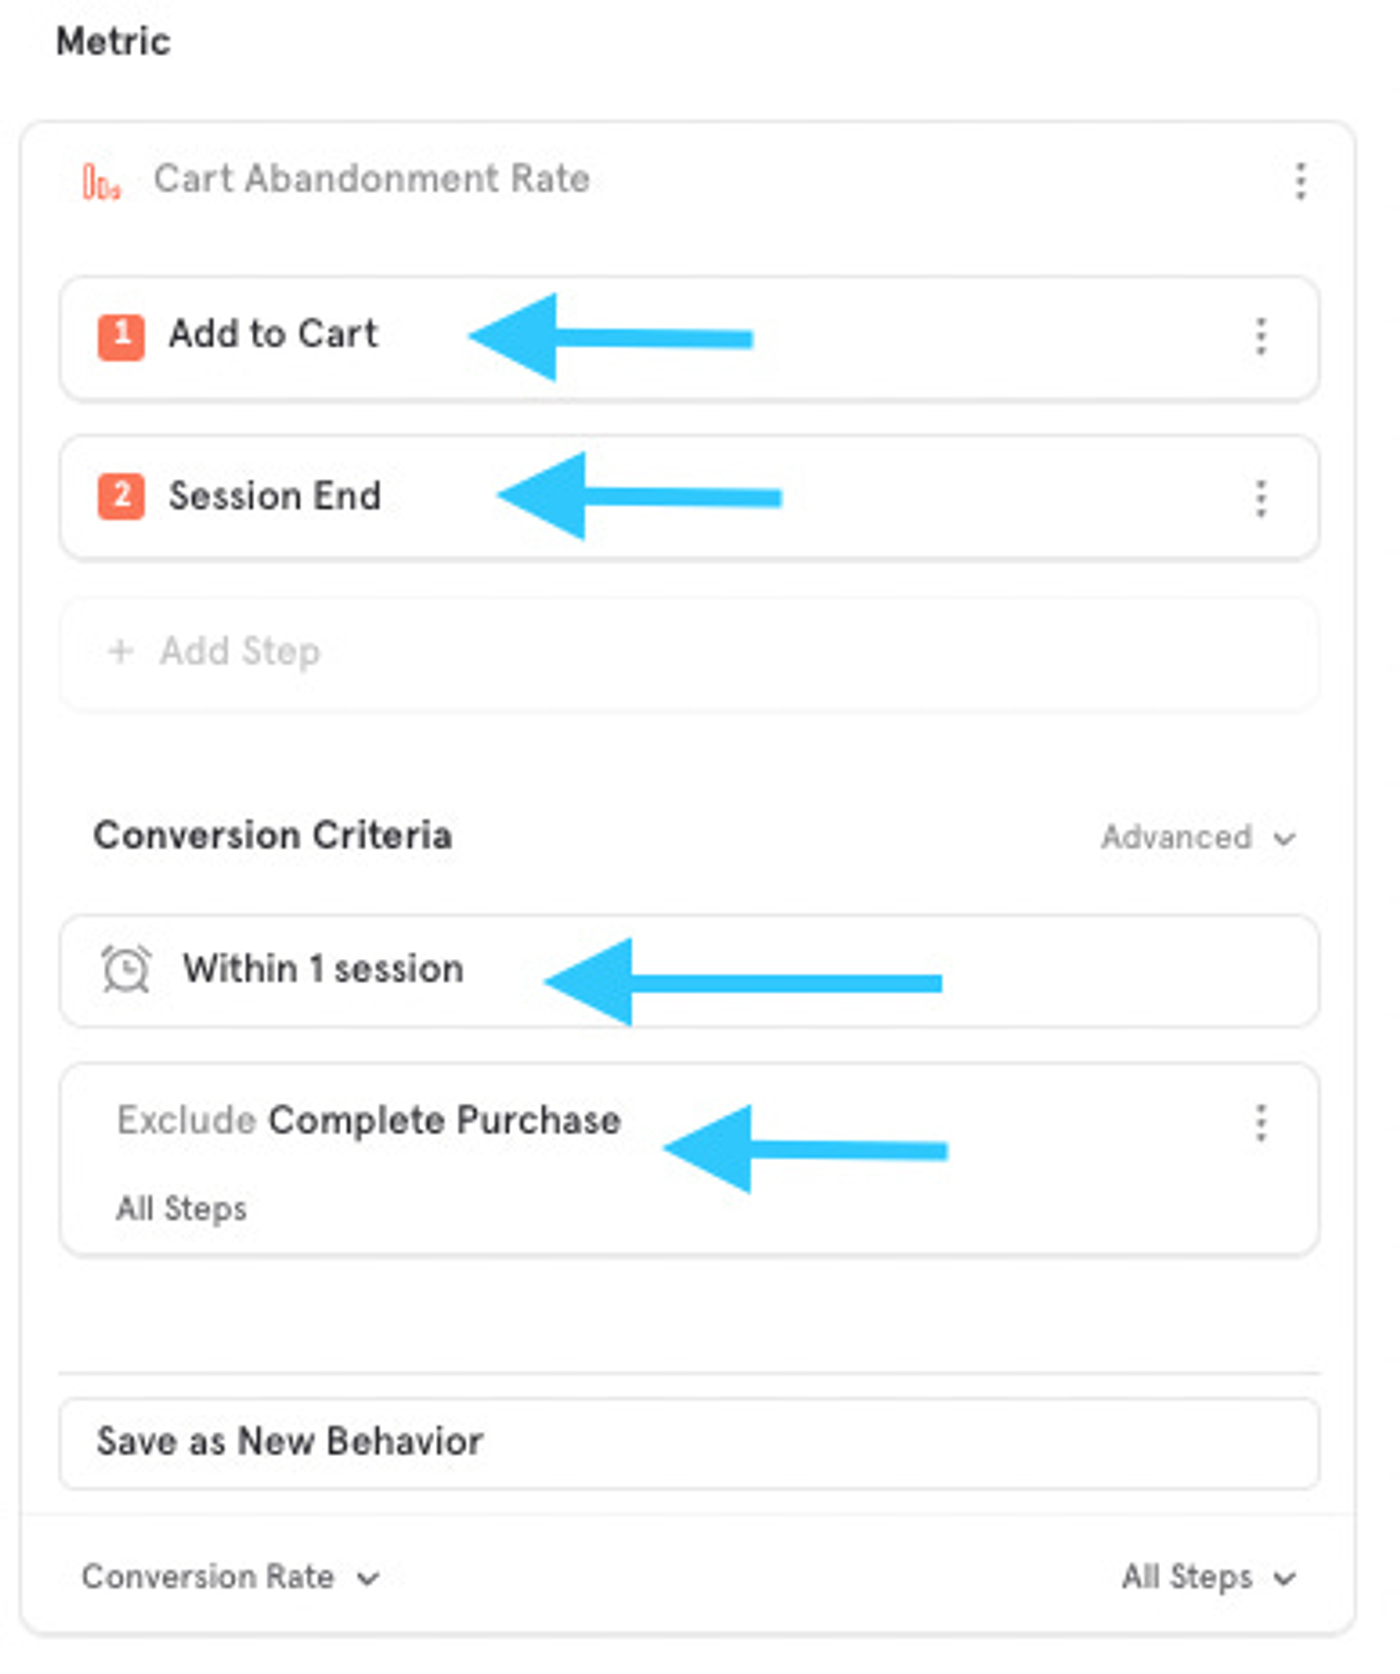
To create this metric in Mixpanel, we create a new Funnels report and select:
Event A: Add to Cart. Event B: Session End. Conversion Criteria: within 1 session. Then go to Advanced Conversion Criteria and select Exclude users who did, in our case the event Complete Purchase. Save this Funnel to use later.
Now that the metric is set up, we can start asking questions and try to answer them with data:
i. What's the cart abandonment rate? Has the trend improved over time?
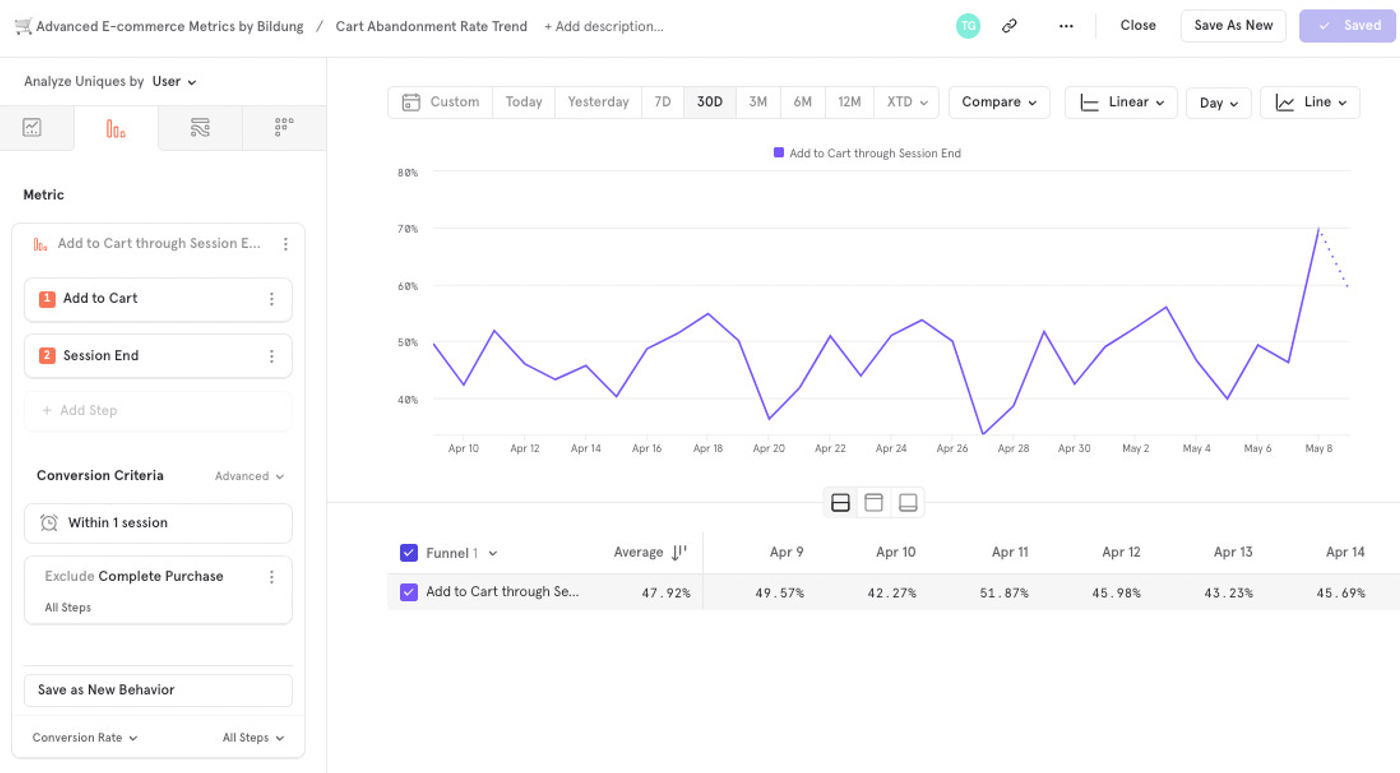
Select the saved Funnel and switch to Line view to see the metric's trend over time.
In this example we can see the abandonment rate varies between 40% and 55%, but yesterday it spiked to 70%.
ii. Is there a category whose items have a worse abandonment rate?
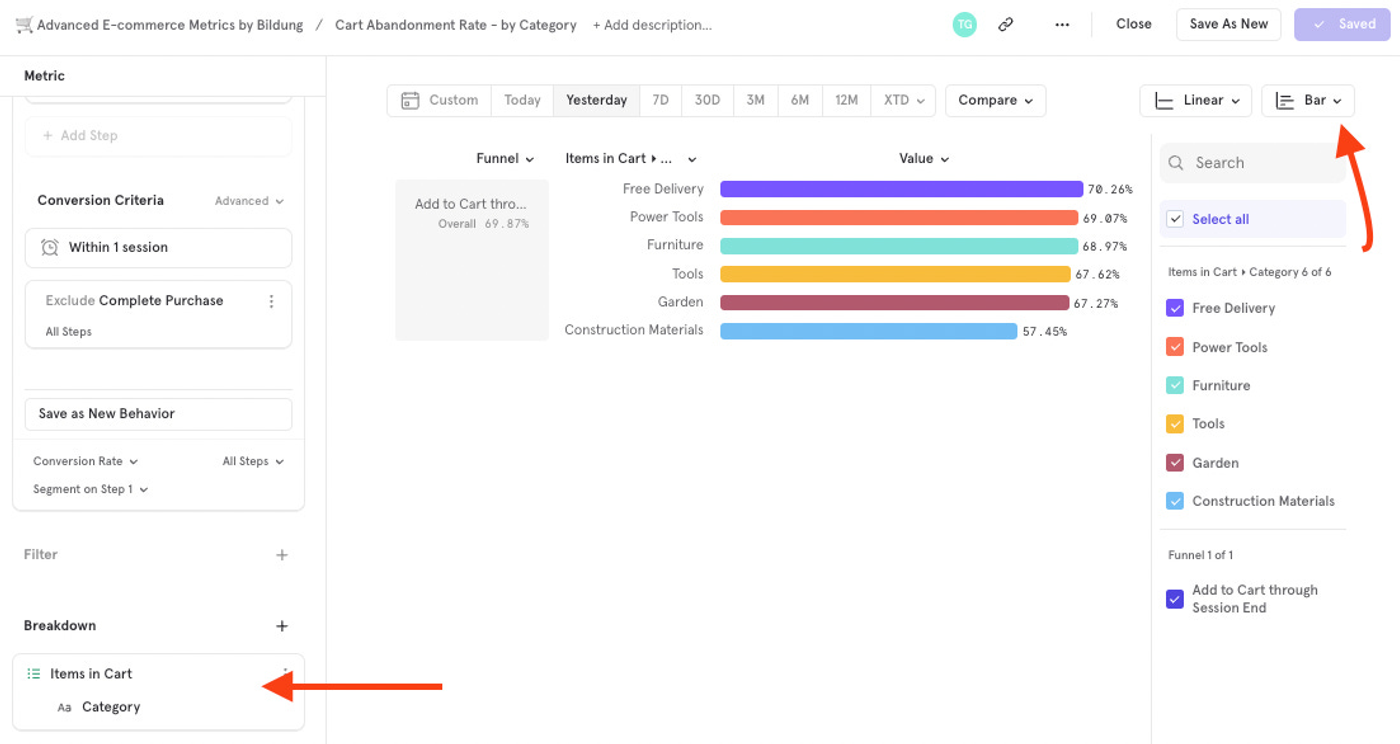
We duplicate the previous funnel, switch to Bar view and break it down by the event parameter that contains the category of the item added to the cart.
In our example we look at yesterday's data (trying to figure out why we had that 70% spike) and we see that all categories seem to have a similar abandonment rate (around 70%), except for "Construction Materials" which has a lower rate.
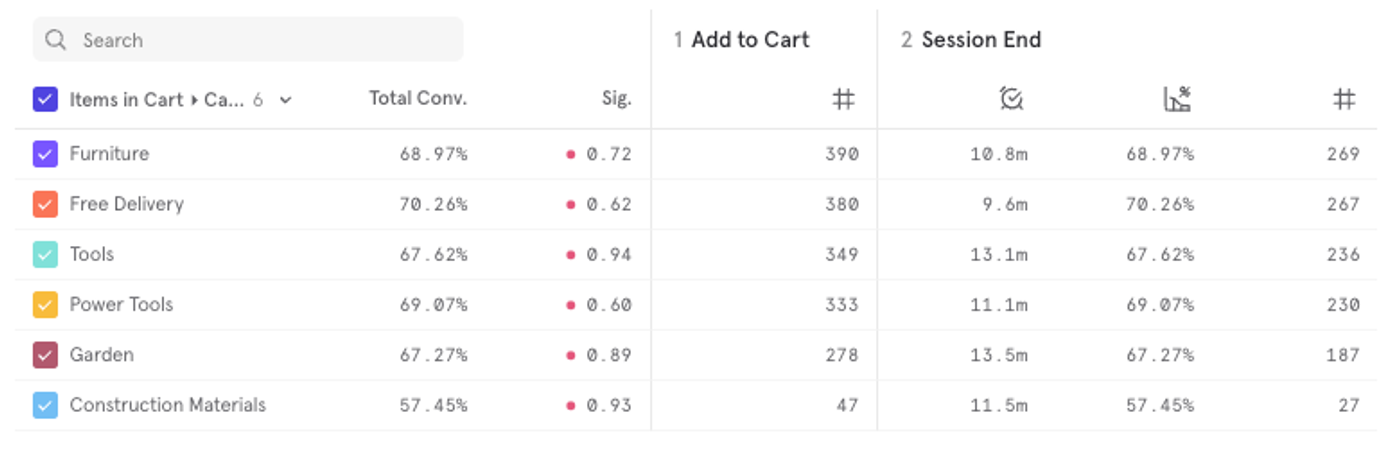
The next question for any stats lover (?) would be to understand whether the size of each of these segments is statistically significant. If we switch the view to Funnel Steps and look at the table below, we can see additional metrics: # of users who did Add to Cart per category, how many of them ended the session without buying, the rate, and the average time to do so. We also see statistical significance: it compares the p-value of conversion rate variation of each group vs total conversion. In this case, since it's below 0.95, we can't be sure that any conclusions we draw will be significant.
iii. Does item price affect the abandonment rate?
Similar to the previous analysis, we take the same funnel but this time, instead of breaking it down by category, we break it down by item price. We can adjust the price buckets if we want to see different ranges.
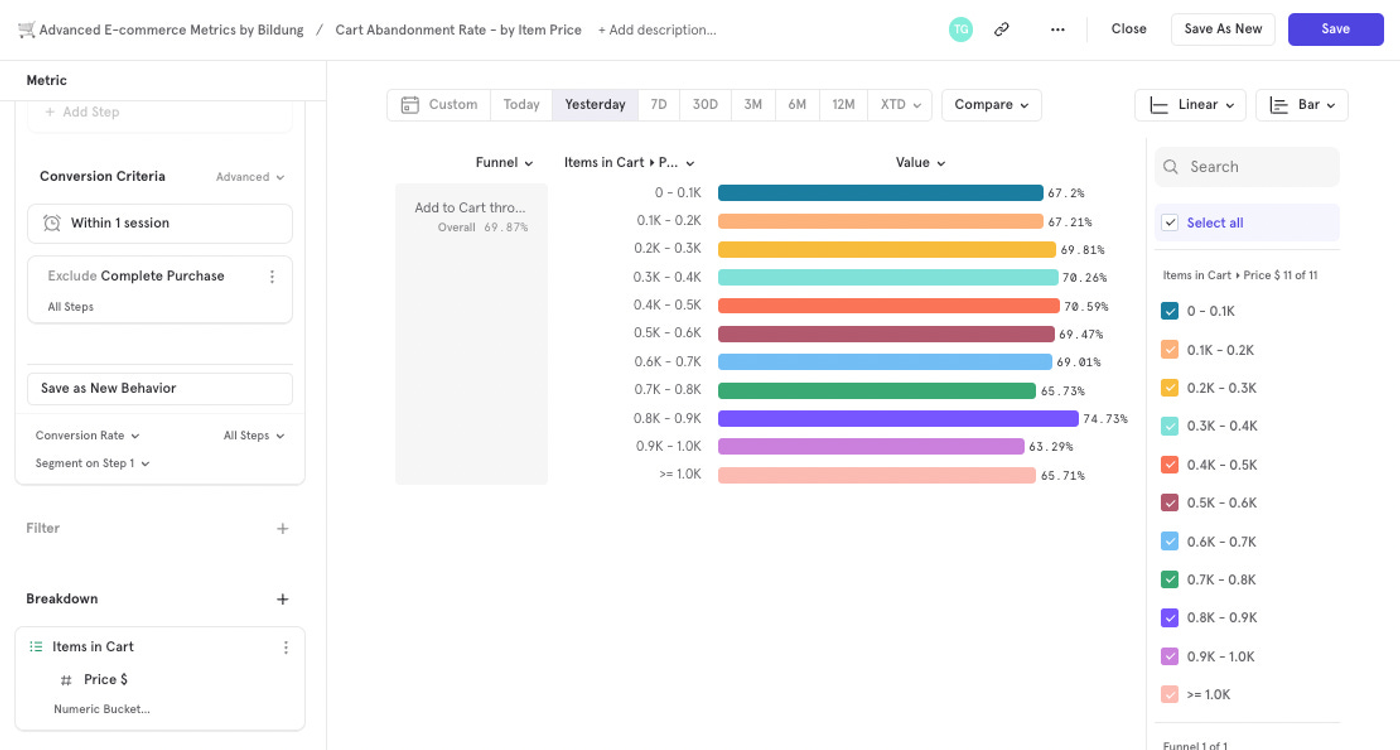
In this example, the abandonment rate looks similar across price ranges. Following the previous analysis, we can look at the Funnel Steps chart to see segment size, conversion time, and statistical relevance.
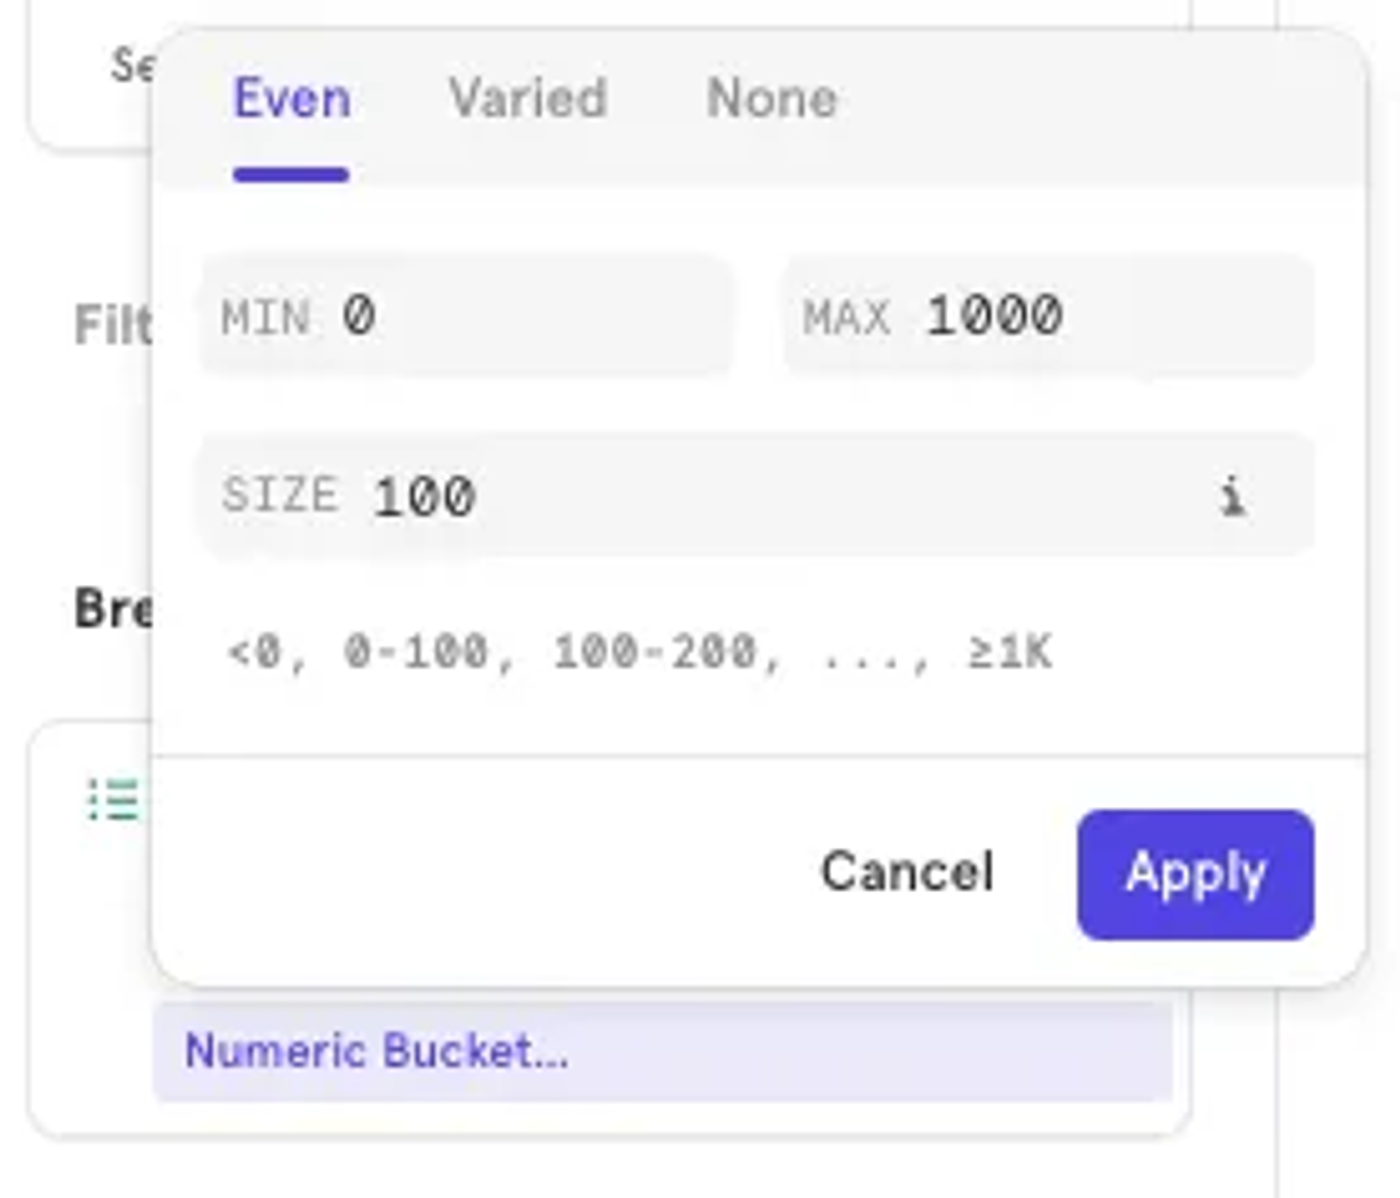
iv. Does adding more products to the cart affect the abandonment rate?
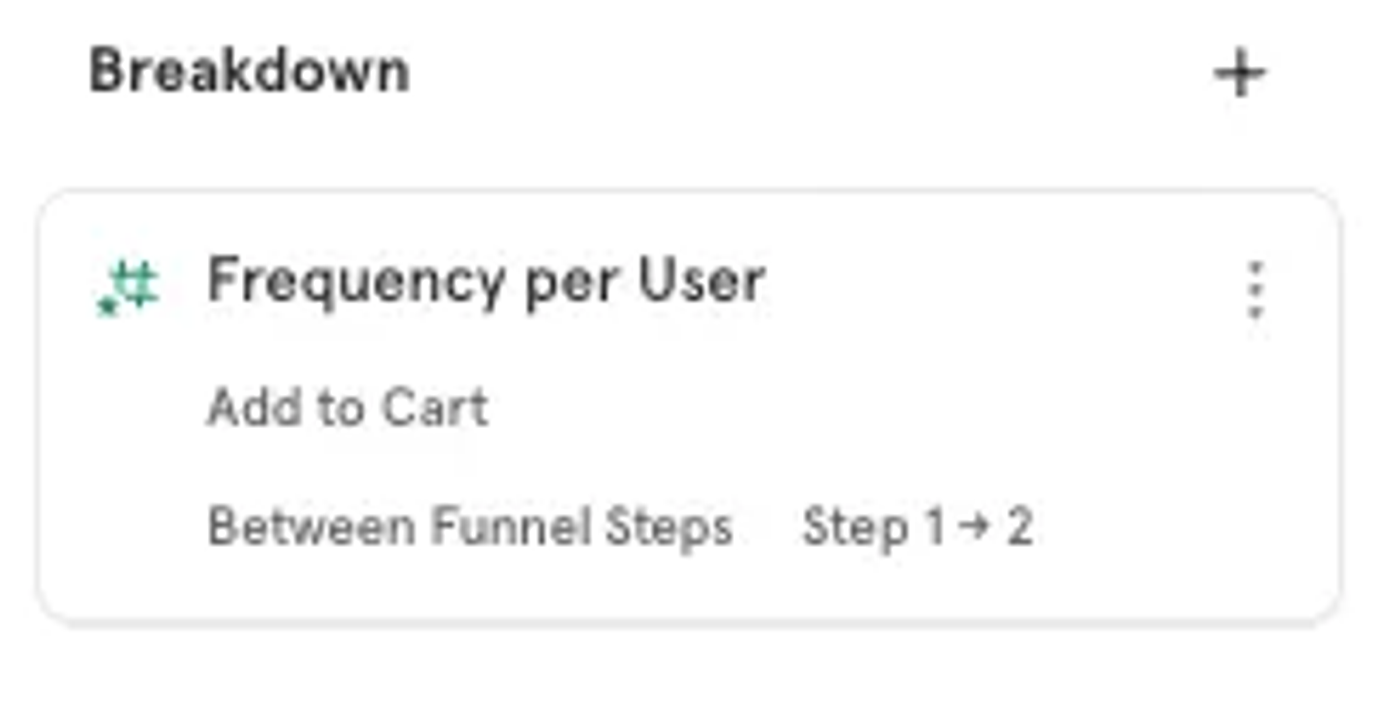
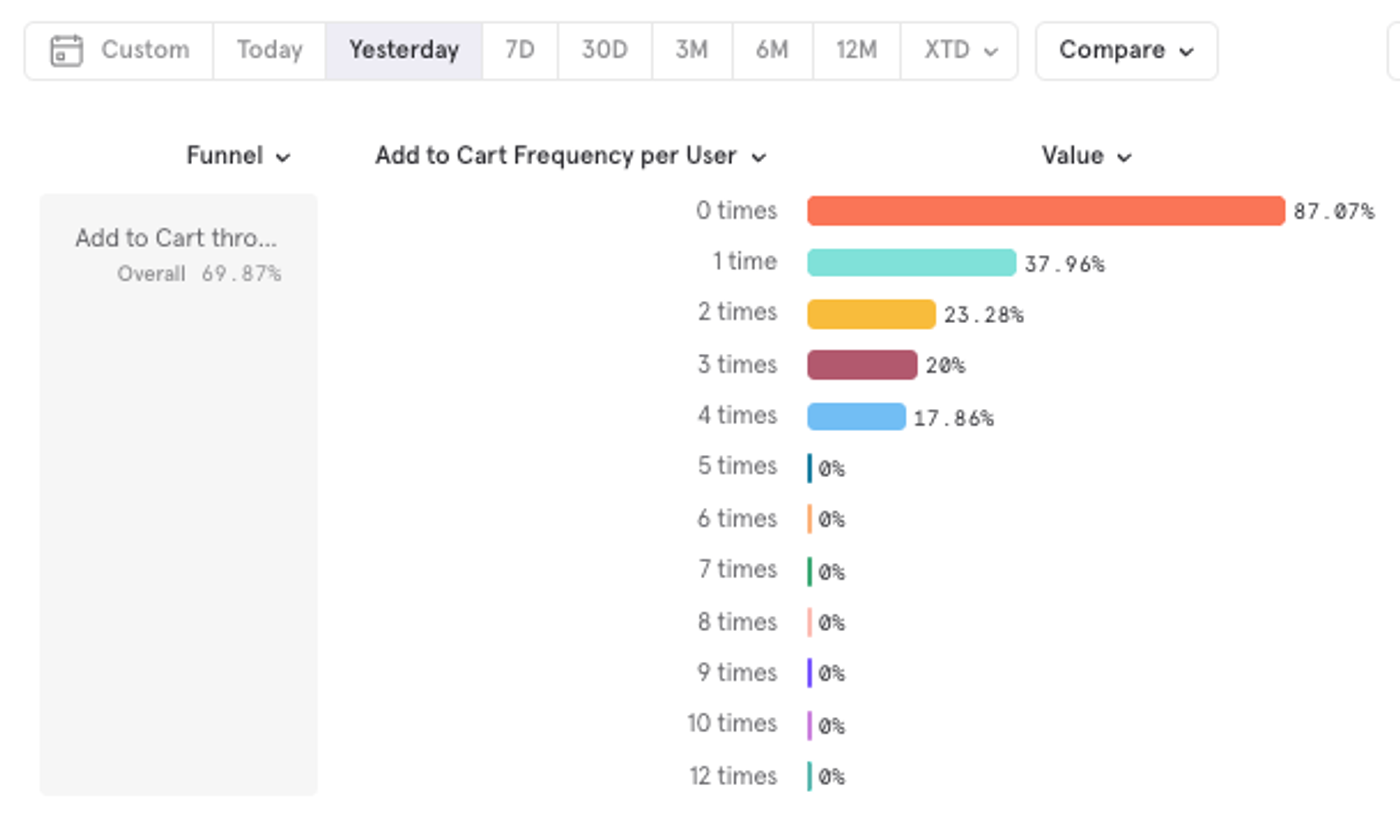
To answer this question with data, we take the same funnel and break it down by Frequency per User on the same Add to Cart event. This lets us visualize the conversion rate to Session End (without a purchase in between) according to how many times the same user added products to the cart between these two steps.
In this example, we see that if the user doesn't add any other product, the abandonment rate is higher. And as they add more products, the probability of abandonment decreases. So it seems worthwhile to prioritize initiatives that let users add more items to the cart —for example, recommending items at checkout.
v. Other questions
These were just a few examples of questions and answers we got with Mixpanel, but there could be many more. Some additional examples we could answer:
- If users add products from different sources of our e-commerce (home, product view, recommended product, checkout…)
- does the abandonment rate change?
- Does longer session time worsen the abandonment rate?
- Do lower-rated products have a worse abandonment rate? Do users from certain acquisition sources have a worse abandonment rate?
Wrapping up
That's it for today. Hopefully this serves as inspiration for questions you can try to answer with data to improve your cart abandonment rate.
At Bildung we help Product and Marketing teams across LatAm make better data-driven decisions. If you want to talk about your challenges and how we can help, get in touch.