Mixpanel + OneSignal: 5 key analyses to improve retention, traffic and conversions
Using this integration smartly lets you understand the real impact of your Email and Push Notification campaigns and make better growth decisions.
At Bildung Data we help product and marketing teams connect data to decisions. One of the most powerful integrations we implement for this is between OneSignal and Mixpanel.
What can you do integrating OneSignal and Mixpanel?
1. OneSignal → Mixpanel
OneSignal sends events like $app_open, $campaign_delivery, $campaign_received and $campaign_open directly to Mixpanel. This lets you measure the real impact of every push on retention, traffic, and conversions. See official docs
2. Mixpanel → OneSignal
From Mixpanel we build dynamic cohorts (for example, users inactive over the last 7 days or who dropped off onboarding) and sync them automatically into OneSignal to trigger personalized, effective campaigns. See official docs
How we generate the insights
Thanks to the OneSignal → Mixpanel integration, we get key events like $campaign_received, $campaign_open and $app_open. That lets us precisely analyze the impact of notifications on product and business metrics.
1. Do push notifications help retention?
What we did in Mixpanel:
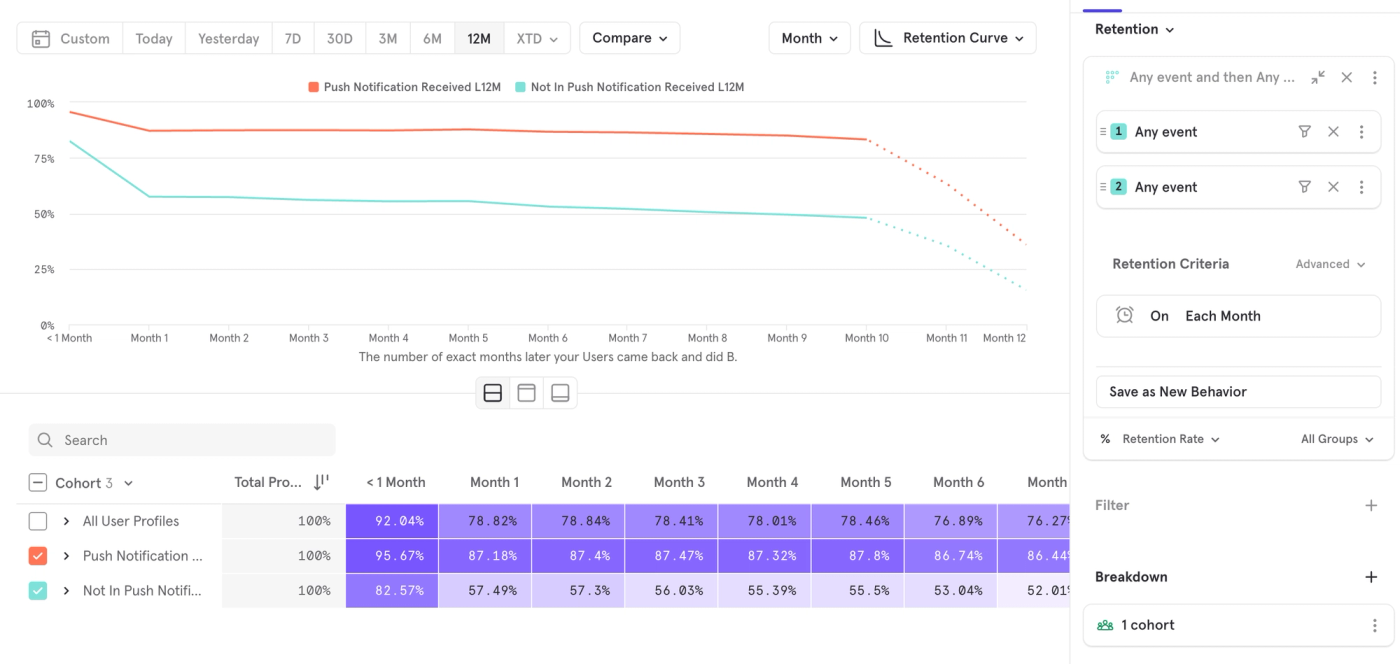
We used the $campaign_received event to build two cohorts:
- Users who received at least one push over the last 12 months.
- Users who received none.
We built a Retention Report in Mixpanel comparing both, week by week.
Result: users who received push had +10pp average retention.
2. Do push notifications drive more buyers?
What we did in Mixpanel:
With the same cohorts:
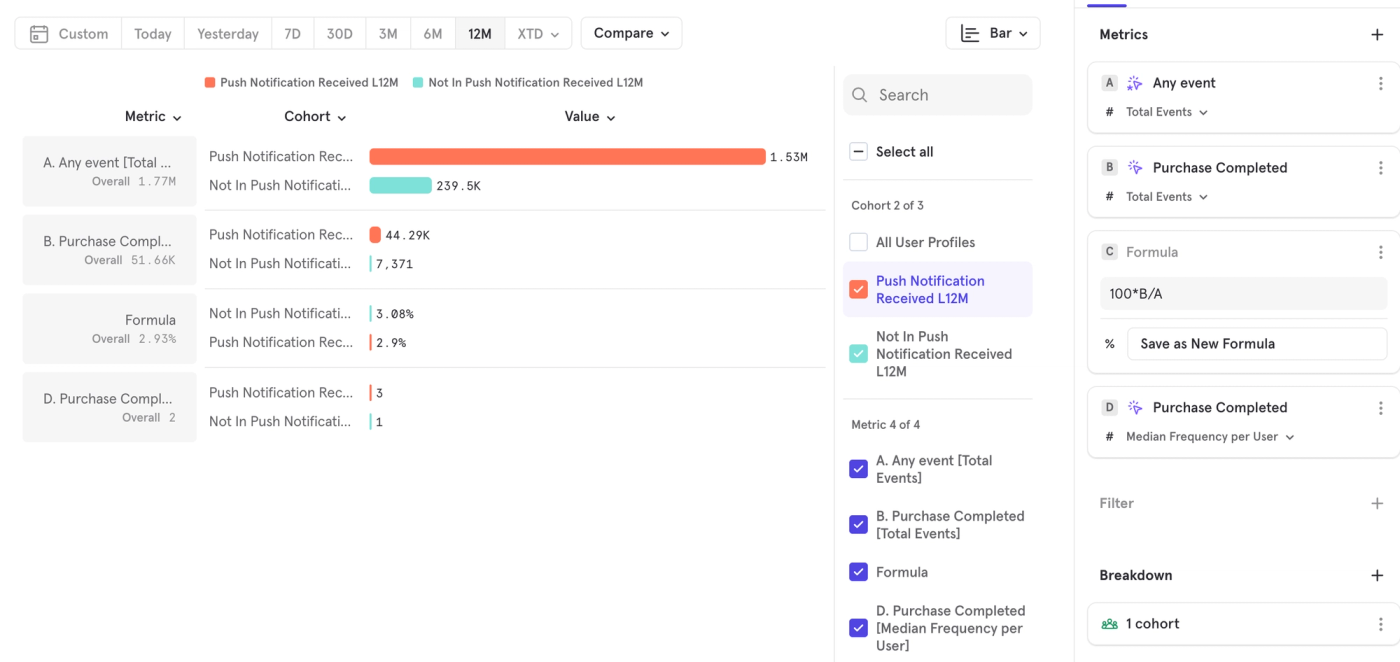
- We analyzed the percentage of users who purchased.
- Total buyer users.
- Average purchase frequency per user.
We built an Insights Report with a bar chart using the purchase event.
Direct impact:
Users who receive pushes:
- 2.9% are buyers.
- Average of 3 purchases per buyer.
Users who don't receive pushes:
- 2.08% are buyers.
- Average of just 1 purchase per buyer.
3. How much of your traffic comes from push notifications?
What we did in Mixpanel:
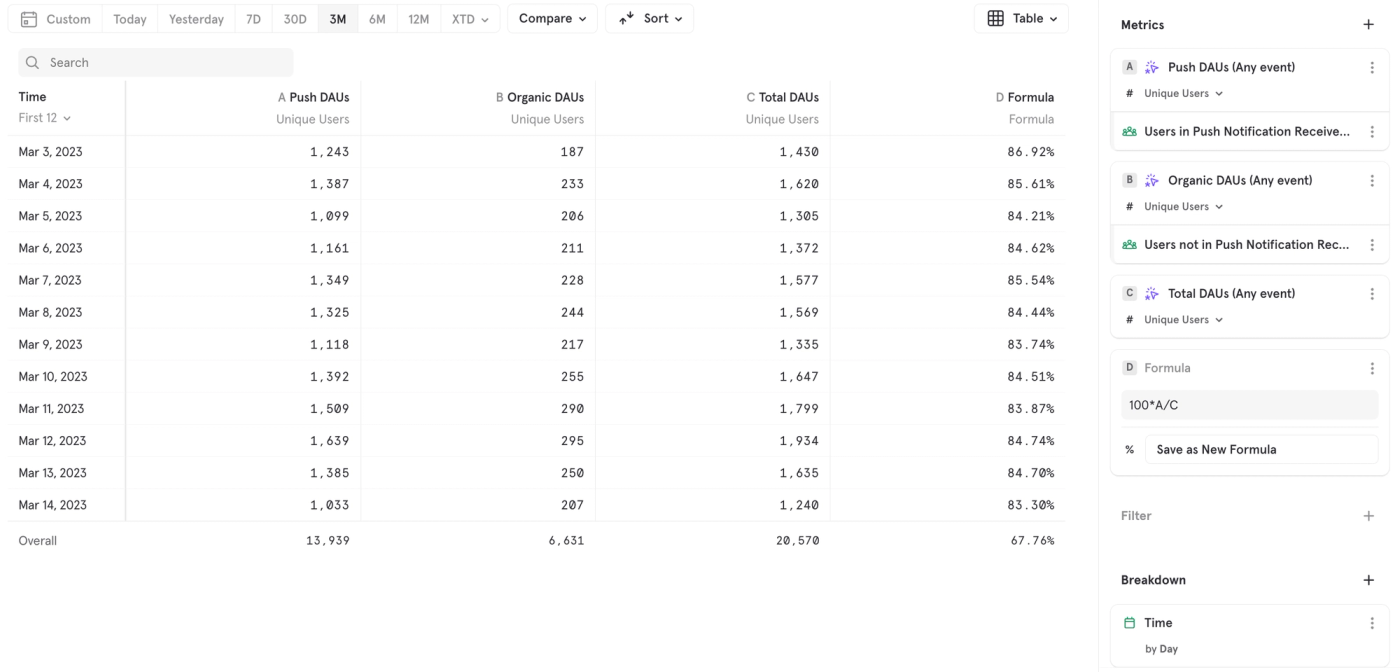
We used $app_open to measure how many of the daily sessions came from notifications.
We built a Table Report filtered to: users whose first event of the day was $app_open from a push. We compared that against total DAUs and total orders for the day.
Insights:
- ~85% of daily traffic comes from users who tapped a push.
- ~25% of purchases too.
4. Are you sending too many pushes?
What we did:
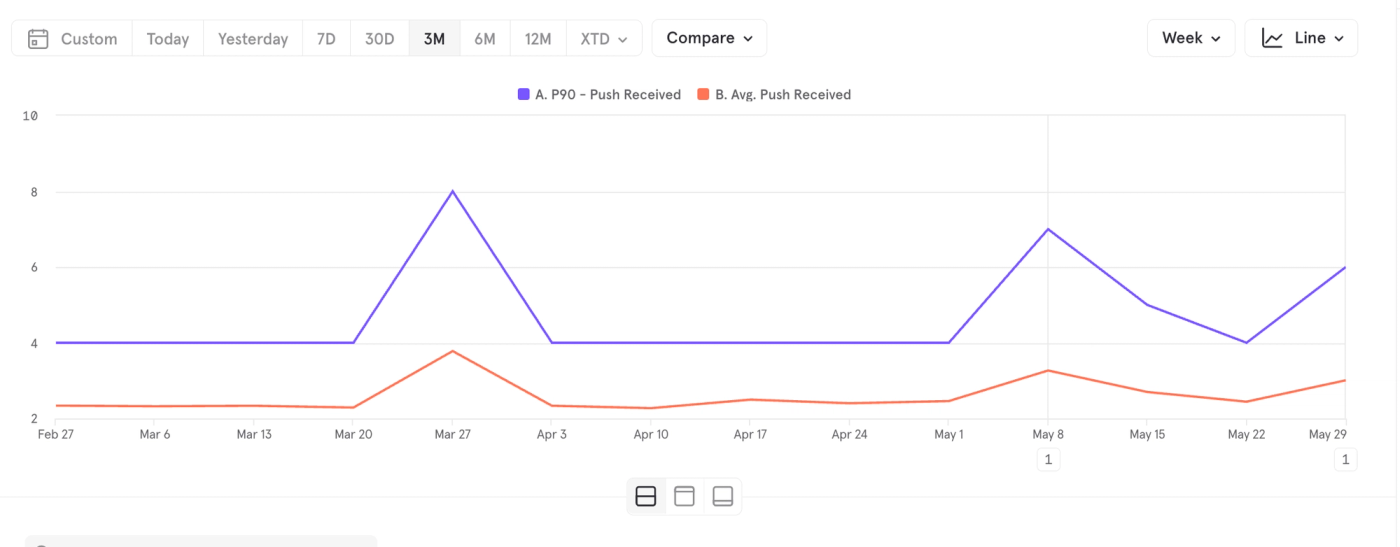
From OneSignal we exported the number of campaigns sent per user per day ($campaign_delivery) plus unsubscribe data.
In Mixpanel we built a report to analyze:
- Average messages sent per user per week.
- How many pushes a user got before unsubscribing.
Result:
On average, 4.2 communications per user per week were going out (push + email combined). That let us adjust the ideal frequency cap to avoid saturation.
5. Which messages perform best?
What we did:
From OneSignal we get $campaign_open and $app_open events with campaign identifiers.
In Mixpanel:
- We built a custom dashboard to monitor CTR and CR by campaign.
- We identified the outliers (good and bad) and pulled out content patterns.
With that we built a content library:
- High-performing pushes to reuse.
- Low-performing pushes to avoid.
Want to activate this kind of insight in your business?
At Bildung Data we integrate Mixpanel + OneSignal and set up these dashboards in days — not weeks.